The rarest scores in premiership rugby
A few weeks ago I looked at some of the most common scores in premiership rugby, this time I'm looking at some of the rarest.
The first place to start is by defining rarity so we'll look at those scores with the lowest frequencies.
We'll also look at relative rarity. Rugby's rather peculiar scoring system means that some adjacent scores are much more likely than others. For example in 25 seasons premiership rugby teams scored 9 points 100 times but 8 points 194 times and 10 points 218 times.
The rules
At this point I should say that I've excluded those impossible scores 1, 2 and 4. I suppose those scores are rare, in the sense that you are unlikely to see them. But the comparison I'd use is that you wouldn't describe a Dodo as rare and like a Dodo these scores are extinct for now.
I also excluded the Covid walkovers. Whilst there were scorelines given they didn't happen.
I've used scorelines from the 25 seasons of premiership rugby from 1997/98 to 2021/22. The current season with its Worcester and Wasps related issues isn't included yet.
I also excluded the Covid walkovers. Whilst there were scorelines given they didn't happen.
I've used scorelines from the 25 seasons of premiership rugby from 1997/98 to 2021/22. The current season with its Worcester and Wasps related issues isn't included yet.
I've also set a limit of scores up to fifty*. Of the 6834 scores in the premiership over the last 25 seasons 108 were greater than 50, making them rare, but not that interesting.
The least common scores (under 50)
Lets start at the start, scores of 0 are very rare. In those 25 seasons only 40 teams had drawn a blank in 7000 attempts. The next lowest score with fewer occurrences in premiership rugby is 45 (32 times). Indeed those scores from 45 to 50 (in total 138) are much less common than the 6 scores before that from 39 to 44 (340 times). And the least common score up to 50? Perhaps unsurprisingly it's 49 which has been scored just 11 times.
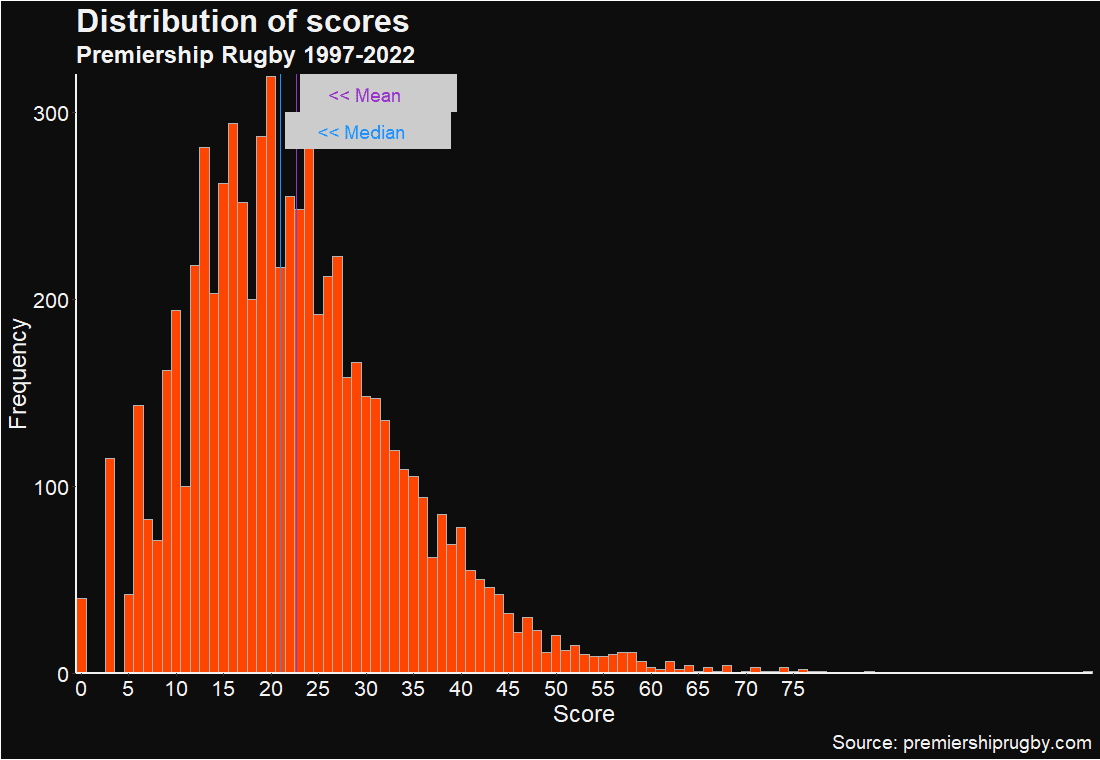 |
| Frequency of scores in premiership rugby |
Relative rarity
As well as absolute rarity I've looked at relative rarity. To do this I've done this by looking at the frequency of a score as a percentage of the two numbers above and below it.
Relative rarity = Frequency / Total Frequency of scores within 2 points *100
Four scores under 50 have a relative rarity of 12 or under; three are low scores (5, 8, 11) and one is of course 49. Each of these scores are more than 40% rarer than they should be relative to their neighbours.
Relative rarity = Frequency / Total Frequency of scores within 2 points *100
Four scores under 50 have a relative rarity of 12 or under; three are low scores (5, 8, 11) and one is of course 49. Each of these scores are more than 40% rarer than they should be relative to their neighbours.
Why are these numbers rare?
The three low scores mentioned above could all be considered to be unlikely to get scores:
- 5 (only scored as an unconverted try),
- 8 (can only be scored as 5+3),
- and 11 can only be scored as 5+3+3).
While 49 needs either the perfection of 7 converted tries or 4 converted tries, 3 unconverted and 2 penalties.
Conclusion
Regular followers of my matchday twitter threads will be aware I have an attachment to the number 49. Despite this clear bias we can say that a score of 49 is about as rare as it gets and should be treasured.
*Was this arbitrary limit put in purely to glorify the number 49? Who could possibly know.
Comments
Post a Comment
Please let me know what you think and leave a comment below