Following yesterday's post showing the charts for forwards in this years European Champions Cup here are some similar graphs for the Backs.
I know this is a massive over simplification but it should act as a bit of a measure for the number of collisions sustained by a player.
Things like interactions at the breakdown aren't counted (because I don't have access to those stats) which is a limitation but still there is some value in these graphics:

Player Work Rate
I've tried to simplify this as much as possible (and make it comparable across the piece) so these charts are simply looking at tackles per 80 minutes and carries per 80 minutes.I know this is a massive over simplification but it should act as a bit of a measure for the number of collisions sustained by a player.
Things like interactions at the breakdown aren't counted (because I don't have access to those stats) which is a limitation but still there is some value in these graphics:
Back 3
Its not much of a surprise that the wingers and fullbacks dont get their hands on the ball that often. Will Addison is a notable exception to this averaging almost 18 carries per game; Taqele Naiyaravoro, Simon Zebo and Nick Abendanon are the other busy carriers.
Elsewhere the prodigious Louis Rees-Zammit is making tackles more often than Jack Nowell, although someway behind Sinzelle and Dirksen (but Rees-Zammit is averaging more than 10 metres per carry).
Meanwhile Andrew Conway and Alex Lewington have presumably been spending matchdays frantically trying to keep warm between sporadic involvements.

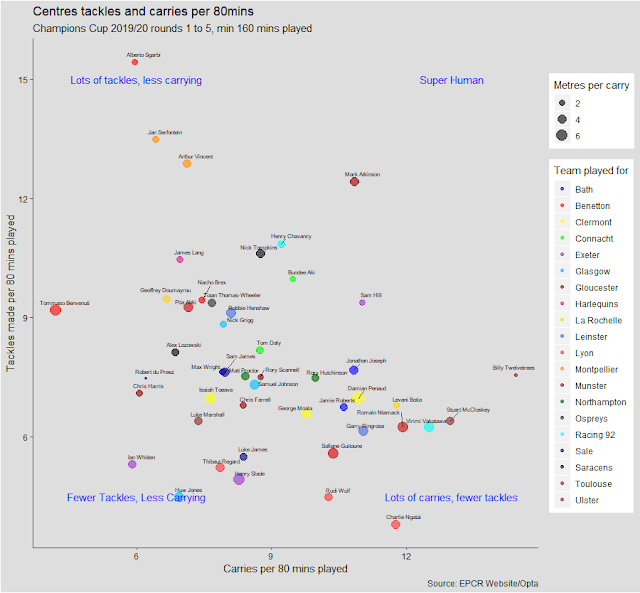
Centres
Looking at the centres Billy Twelvetrees is leading the way for carries per 80 mins, his Gloucester teammate Mark Atkinson is the closest centre to the super human category (he's no CJ Stander though). Sam Hill and Nick Tompkins are both having excellent seasons and this is reflected in their positions in the chart.
Alberto Sgarbi has averaged more than 15 tackles per 80 minutes and is closely following by the Montpellier pair Jan Serfontein and Arthur Vincent. Similarly the Exeter pair of Henry Slade and Ian Whitten are both in the bottom left of chart.

Half Backs
And finally the half backs, these guys clearly have much more to their games than simply carrying and tackling however if anything this makes the graph more interesting. The Connacht fly halves Jack Carty and Conor Fitzgerald feature heavily both tackling and carrying, while Northampton's Dan Biggar and Cobus Reinach get through a good number of tackles as do the young English pair of Manu Vunipola and Marcus Smith.
Finally Bath's struggles in the competition may not be unrelated to Chris Cook and Freddie Burns both featuring towards the bottom left, though their West Country neighbours Joe Simmonds and Nic White arent that far away during Exeter Chiefs unbeaten run through the first five matches of the competition.

Finally Bath's struggles in the competition may not be unrelated to Chris Cook and Freddie Burns both featuring towards the bottom left, though their West Country neighbours Joe Simmonds and Nic White arent that far away during Exeter Chiefs unbeaten run through the first five matches of the competition.

Comments
Post a Comment
Please let me know what you think and leave a comment below